In a region as diverse as Asia investors can lean in and take advantage of inefficiencies and inconsistencies around growth, central bank policy and diverse regulatory regimes.

Asset owners in the region are increasingly finding active management, across all asset classes, optimises returns and reduces risk.

APAC fixed income offers rich pickings for active investors prepared to venture away from an off-the-shelf passive exposure and open the door to the region’s diverse opportunities across credit quality, duration and interest rate sensitivity.

An example could be an Australian core bond fund which combines government and corporate issuers in a barbell position with AAA, long-maturity Australian government bonds sit on one end for ballast, and high-quality investment grade bonds focused on income and yield, on the other.

Anthony Kirkham

This allocation could mitigate volatility from riskier parts of a portfolio like equity, but at the same time capture yield and income in the investment grade space, explains Anthony Kirkham, portfolio manager at Western Asset Management, a division of Franklin Templeton, speaking to Top1000funds.com from the Melbourne office.

“Such a portfolio might have an overweight in credit in shorter maturities where credit spreads are attractive and can provide good income. At the same time, it might hold a greater weight of the longer maturities, particularly in the 10- and 20-year parts of the curve in AAA government securities that would behave the way you want them to during periods of risk off,” he says.

Japan’s $1.6 trillion Government Pension Investment Fund (GPIF), whose active equities added huge value in the past year, also recently switched the mandate of a Y9 trillion ($62 billion) domestic bond fund from passive to active management: GPIF currently allocates 51 per cent of domestic bonds to active strategies.

Active management also helps investors navigate APAC’s patchwork of fiscal policies. Active managers can capture any move in yield curves based on specific central bank policy, for example.  The difference between most of the region’s central banks and the Bank of Japan, currently on a tightening cycle, is a case in point.

“When you understand the different characteristics, you can add more value in these markets through outright duration positioning, or by actively managing your yield curve positioning,” Kirkham continues.

He adds that active management also allows investors to navigate currency volatility and can be a useful alpha generator.

“Currency volatility is a risk that needs to be managed or mitigated. We find some clients want to avoid it and others are prepared to take a little risk,” he says.

Active management also allows investors to navigate regulatory risk. For example, when China’s regulatory crackdown on the construction sector spooked investors and hit the property bond market, it led to a sharp decline in the value of developers’ US dollar-denominated bonds sharply lower.

“You can’t avoid thinking about regulatory risk,” says Kirkham, who flags risks such as the regulatory limits placed on different funds and the fact regulation adds to the costs of doing business and can also impact liquidity if it becomes difficult to trade.

For active investors, regulatory knowledge is just another opportunity to lean into, says Connie Chan, managing director of investments at Temasek, speaking during the latest annual review. Singapore’s S$389 billion state-owned investment firm has around 48 per cent of the portfolio in liquid and/or listed assets.

Connie Chan

“We see continued structural reforms in a number of (APAC) markets. This has helped to reduce supply-side constraints, create more open and competitive markets, as well as improve productivity,” she says.

Active management also allows investors to be thoughtful around correlations. For example, the Hong Kong Monetary Authority pegs the Hong Kong dollar to the US dollar and closely follows Federal Reserve strategy. Many other regional central banks also keep a close eye on their currency relative to the US dollar.

“This is important to understand when sizing positions,” says Kirkham. “Many countries are cognisant of Fed strategy when adjusting their own monetary policy which can have an impact in terms of currency and economic growth in that country.”

Active management brings the depth of analysis needed for navigating such a diverse region. At Western Asset Management, the team draws on expertise from local and global analysts, with the latter able to provide insights on global issuers using local markets to fund themselves. For example, in Australia around half the credit market consists of foreign issuers with local operations seeking to diversify their funding sources.

Meanwhile, local analysis provides granular expertise and insight on less efficient pricing mechanisms that reflect asymmetric information in the market.

Investors targeting sectors and countries

At Japan’s $1.6 trillion Government Pension Investment Fund (GPIF) active equity is gaining traction after the fund attributes its latest, record gains to active investment in Japanese (and foreign) equities. GPIF’s domestic equity allocation returned a massive 41.4 per cent for the financial year ending March 2024.
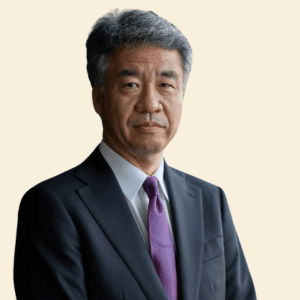
Eiji Ueda

GPIF only allocates about 4 per cent of its domestic equity portfolio (around 25 per cent of AUM) to active funds, down from levels closer to 13 per cent 10 years ago. But under a new strategy introduced by chief investment officer Eiji Ueda, at the helm since April 2020, GPIF has increased the number of active domestic equity mandates to 23 across Japanese and international managers. In a hallmark strategy he is reconstructing active equity by choosing managers based on the consistency and stability of their excess return in addition to qualitative selection.

“We expect our active portfolio to generate excess stable returns in the future,” he states in GPIF’s latest annual report.

In another example, the New Zealand Superannuation Fund runs a dynamic asset allocation program called strategic tilting that takes exposures to markets across multiple asset classes. As part of this, the $77.1 billion investor strategically tilts exposures to a group of emerging markets that includes countries across the Asia Pacific.

 “In our strategic tilting program, we are overweight equities and currencies in emerging markets.  Most of this emerging market exposure is to Asia,” says Alex Bacchus, acting chief investment officer at the fund until December 1.
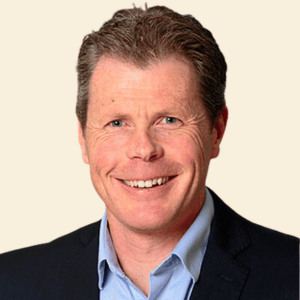
Alex Bacchus

Elsewhere, deliberate stock picking strategies allow investors to single out opportunities in specific market segments, such as China’s manufacturing and consumer goods sectors; Japan and Korea’s auto and advanced technology sectors; India’s pharmaceutical industry and Australia’s natural resources. This approach is particularly effective in the current climate given the different growth drivers fuelling Asia’s economies and the slowdown of growth in China.

It’s an approach honed by Temasek where APAC exposure includes a 27 per cent allocation to Singapore including stakes in many companies listed on the SGX; a 19 per cent allocation to China and 7 per cent allocation to India where Chan says the firm plans to invest more.

“We will increase our focus on India, as it has a large and growing domestic market, in addition to being a beneficiary of supply chain diversification. In the rest of Asia, we are looking to increase our exposure to Southeast Asia and Japan. As an active shareholder, we engage with our portfolio companies on their growth strategies and plans to create shareholder value,” she says.

Published in partnership with Franklin Templeton Investments

Opportunities in APAC: Diverse and dynamic

The list of reasons to invest in APAC is compelling and institutional investors in the region are increasingly tapping the opportunities. Top1000funds.com looks at the different levels of income, volatility, efficiency and ultimately returns across the region.

Interim investment strategy at Ireland’s two new Future Funds will be highly conservative for the first six to nine months. The €8.4 billion Future Ireland Fund, FIF, forecast to grow to €100 billion by 2035, and the €2 billion Infrastructure Climate and Nature Fund, ICNF, have been set up to invest windfall receipts from multinationals like tech and pharmaceuticals attracted to Ireland because of its low corporation tax rate.

For now strategy will comprise low risk allocations to high credit quality Euro-area sovereign and quasi-sovereign bonds with the aim of generating stable and reliable returns with minimal risk. Cash investments must have a credit rating of A- or higher, and a maximum maturity of three years.

Even in this interim stage, the investments will integrate ESG and align with the sustainable investment strategy of sister fund, the €10 billion Strategic Investment Fund, ISIF, adapted to reflect the FIF’s more limited investment universe.

“We will have invested more than €10 billion in the two funds by the end of the year, with that figure expected to rise to €16 billion by the end of 2025,” says Minister of Finance Jack Chambers.

“These two long term savings funds are a vital element of managing the state’s finances in a prudent and responsible manner over the coming decades. In using the proceeds from volatile windfall tax receipts to help us meet the challenges we know our country will face, rather than using them to fund existing day to day expenditure, we are safeguarding and protecting our future.”

Putting the infrastructure in place

Over the next six to nine months the National Treasury Management Agency, NTMA, mandated by the government to manage the investments, will design different and appropriate long-term strategies for both funds.

The NTMA will also put in place the necessary people – recruitment of a director to lead a new business unit is already underway –  skills and supporting infrastructure to manage the funds for the long term.

Required structures include the procurement of a custodian to hold and safeguard the assets and hiring a panel of investment managers to implement aspects of the long-term investment strategy.

A new investment committee will be established by the NTMA to oversee the funds and the number of NTMA board members will be increased by two.

The investment strategies for the FIF and ICNF will be subject to consultation with the Minister for Finance and the Minister for Public Expenditure.

Investing for the future

Despite the forecast growth of the fund, the tax windfall could prove temporary. For each year from 2024 to 2035 the government says it will invest 0.8 per cent of GDP, estimated at between €10-€12 billion a year. But tax receipts are volatile and could dry up.

Ireland’s corporate tax rate is 12.5 per cent, one of the lowest in the world, compared with a global average of 23 per cent, according to the Tax Foundation. The government can access the fund from 2040 for pensions and health spending for an ageing population, plus decarbonisation and digitisation projects.

“New Zealand, Norway, Canada and Australia are among a number of sovereign wealth funds around the world that [the government] has taken into account in planning for the Future Ireland Fund, said a spokesperson at NMTA. “These funds offer very useful guidance,” they said.

However, using elevated tax receipts to set up a sovereign wealth fund is unusual.

The Infrastructure, Climate and Nature Fund’s purpose is to support government expenditure where there is “a significant deterioration in the economic or fiscal position of the state” in the years 2026 to 2030 on designated environmental projects. Up to 22.5 per cent of the assets under management can be used in any given year after 2026.

The two new funds will sit alongside the €10 billion ISIF which has its own mandate to invest with a specific double bottom line to generate return and economic activity in Ireland.

Recent ISIF investments include new port infrastructure in Cork Harbour which will accelerate the deployment of Ireland’s first offshore wind projects, on the east and south coast. Elsewhere ISIF recently committed over €1.5 billion to housing investment in Ireland to act as a catalyst for attracting third-party co-investment hoping to unlock up to €1 billion of wider homebuilding activity.


In a dramatic purge in a pension sector renowned for its stable governance, the government in Canada’s western province has removed the entire board of the $160 billion Alberta Investment Management Corporation (AIMCo) and sacked its CEO, citing rising costs and poor returns.

The province’s finance minister conservative Nate Horner, who has been in the position since June 2023, has been appointed the sole director and chair for AIMCo on an interim basis. Before being elected to parliament in 2019 aged in his mid-30s, Horner was a rancher with a cow-calf mix farm operation.

The abrupt departure of AIMCo’s chief investment officer Marlene Puffer earlier in September foreshadowed the most recent turmoil. Puffer joined AIMCo in 2023 from Canada’s railway pension fund CN Investment Division and was part of a new management team put in place to shore up governance at the asset manager after 2020 losses.

“Last week’s wholesale dismissal of AIMCo’s new board and senior management team is difficult to understand,” Keith Ambachtsheer, University of Toronto Rotman School of Management executive in residence and pension system luminary, told Top1000funds.com. “Was there something in the benchmarking process that triggered the Alberta government’s actions? If not, was fraud or major conflicts of interest detected? Also, what makes the government think it can improve on the high quality of the board and executive team it just fired?”

Another industry insider called the sacking “sensational” noting  noone in the wider industry “saw it coming.”

“Most of the major commentators agree that this was unprecedented,” they added.

A new board chair will be appointed within 30 days, Alberta United Conservative Party premier Danielle Smith said in a statement.

Meanwhile, the ousted board included pension veterans like interim chair Ken Kroner and Jim Keohane, the former chief executive of the Healthcare of Ontario Pension Plan.

AIMCo’s chief executive officer, Evan Siddall, in the role since summer 2021, was also fired. Ray Gilmour, deputy minister of executive council, a senior public servant in Alberta, has been appointed interim CEO.

Pressure to invest more at home

One rationale for the board overhaul could be a push by policy makers to get the fund to invest more at home. Alberta’s premier Danielle Smith has made it clear she wants the pension fund to put more capital to work in Alberta.

Some stakeholders have already voiced concerns that this could mean more investment in fossil fuels.

Like Alberta Federation of Labour (AFL) president Gil McGowan who said the billions of dollars of pension assets controlled by AIMCo belong “to workers, not the government,” continuing, “workers with money in pensions need to know they are secure. They remember Danielle Smith musing about using pension funds to prop up oil and gas companies that couldn’t otherwise get financing. They remember Danielle Smith musing about setting up a sovereign wealth fund, but she hasn’t been clear where the money would come from. Albertans are jittery. Rightly so.”

The encroaching politicisation of Canada’s $4.1 trillion Canadian pension industry was front of mind at FIS Toronto earlier this year. Ambachtsheer and the former chief executive of CPP Mark Wiseman warned the founding principles that have made Canadian funds exemplars around the world are under attack.

“The Canadian model is under threat today,” Wiseman said. “When you see trillions of dollars in assets, when you see a government that is running deficits, when you see economic malaise – and we’ve seen this in other jurisdictions –this is the time when pension assets get raided. And I’ll use that term, because that is the risk that I think the Canadian model faces today.”

Wiseman warned that the issue is “much more acute than people think”.

“It will come under a different guise, it’ll be said, ‘you should invest more in Canada’, ‘you should invest more in infrastructure’, ‘we should let people have access to their capital earlier’, or whatever excuse may be the fact of the day.”

Rising costs and struggling returns

AIMCo posted an overall return of 6.9 per cent in 2023 despite challenges in its real estate portfolio. The return, though positive, fell below its benchmark return of 8.7 per cent and policy makers, including Minister Horner, cited rising costs and poor returns as a key rationale for the re-set.

According to a statement from the government, between 2019 to 2023 AIMCo’s third-party management fees increased by 96 per cent; the number of employees jumped by 29 per cent and wage and benefit costs increased by 71 per cent. AIMCo has around 600 employees spread across seven offices in Canada, London, New York and Singapore.

One reason for rising costs has been the push into alternatives. Like the growing $7 billion private credit portfolio where the organization has recently expanded its talent base with new hires in New York and a strategy to push into large cap partnerships and deal flow out of the US.

The investor has also attracted criticism in recent years from some of its member funds. AIMCo manages assets for 17 pension funds and organizations, a more complex job than overseeing one single pool of capital. Speaking at FIS Toronto earlier this year, Puffer explained the complexities of running money over 32 pools of capital and paying attention to each client individually.

“We need to make sure we’re delivering what each client actually needs. Not just at the total portfolio or total fund level,” she said.

For more on this topic see below

The politicisation of investments at US public funds

Norway’s sovereign wealth fund, Government Pension Fund Global, has topped the list of the most transparent funds according to the Global Pension Transparency Benchmark’s 2024 findings, scoring a perfect 100 out of 100.

In the four years the GPTB has been measuring transparency of global funds, the Government Pension Fund Global has improved its score by 27 points from 73 in 2020 to 100 in 2024.

Executive leadership at the Government Pension Fund Global have put transparency front and centre over the past few years and the improvements in the score reflect that dedication. [See Why transparency is strategic initiative for Norway’s SWF]

The GPTB, a collaboration between Top1000funds.com and CEM Benchmarking aimed at measuring the transparency of disclosures across cost, governance, performance and responsible investment in a bid to improve the industry transparency, asks binary questions: does a fund disclose something, or not.

Edsart Heuberger, CEM Benchmarking’s product lead for transparency benchmarking, says the GPTB measures the completeness of the disclosure, but not necessarily the quality.

“Mind you, in our experience, the leading funds clearly have higher quality disclosures, and the Government Pension Fund Global has best-in-class reporting. Their materials are a joy to read,” he says.

“Addressing gaps in reporting isn’t always trivial. In some cases, the data needs to be sourced internally or by third parties. We understand the Government Pension Fund Global had to lobby the Ministry of Finance this year to provide more transparency on governance to achieve their new score.”

Like last year, CPP Investments was ranked second, only narrowly beaten by Government Pension Fund Global. CPP Investments, which topped the benchmark in the first and second editions, improved its score from 88 last year to 96 in 2024.

CalPERS was in third spot this year, jumping from fourth in 2023 and displacing AustralianSuper, which slipped to equal seventh.

This year the top 10 funds globally were particularly competitive, with an average score improvement of 10 points. So, while AustralianSuper scored two points higher than it did last year, it was leapfrogged by others with greater improvements.

The fourth edition of the GPTB again reveals that increased scrutiny on public disclosures is driving measurable transparency improvements. Last year, 77 per cent of the reviewed organisations improved their total transparency scores, while this year 69 per cent of funds scored higher.

In 2024, the average fund scored 63 out of 100, versus 60 last year, and 55 in 2022. The funds at the top of the rankings continue to improve the most.

This year 19 funds scored over 80, compared to nine last year, and six scored over 90. Further, nine of the top 10 most-transparent funds scored the same or higher than the most-transparent fund last year.

“For leading funds, the GPTB methodology has become a roadmap for improving transparency. These funds have addressed the gaps in their score,” Heuberger says.

But while there have been huge improvements in transparency at the top end of the fund rankings, there remains a big gap between the leaders and the laggards. The lowest-ranked fund scored only 14 overall.

“Surprisingly, we continue to see few improvements from funds that were laggards in the first edition of this benchmark,” Heuberger says.

“The laggards then are still the laggards now. The gap between the best and the laggard funds is increasing, which is unusual for most benchmarks.”

For the fourth year running, Canada is number one in the country rankings of the Global Pension Transparency Benchmark, according to the 2024 results. Each of the five Canadian funds in the benchmark are ranked in the top 11 funds globally.

Not only was Canada nine points clear of the second-placed Australia, but it had the narrowest margin between its top- and bottom-ranked funds (scores ranging from 87 to 96).

Canada dominated in transparency of disclosures in governance, performance and responsible investment, taking top spot in all three; while The Netherlands took out the top spot in cost disclosures.

While Canadian funds score well across all four factors, they are particularly strong in governance. Three of the five funds that earned a perfect score on the governance factor are Canadian and all Canadian funds scored 97 or higher.

“Strong, independent governance is perhaps the most important element of the Canadian model,” according to Edsart Heuberger, CEM Benchmarking’s product lead for transparency benchmarking.

“Clearly, transparency on governance matters to them, too.”

Heurberger says for leading funds, the GPTB methodology has become a roadmap for improving transparency.

“These funds have addressed the gaps in their score. Governance, as an example, is an area where funds typically own all the data that is required to achieve a score of 100 – they just need to disclose.”

Australia ranked second in the country scores this year, moving up from fourth four years ago, when the benchmark was launched.

The Netherlands ranks third, and the Dutch funds continue to provide the best public disclosures on costs.

Heurberger also acknowledged the Nordic funds, which continue to improve transparency scores on the back of great responsible investing reporting.

The GPTB, a collaboration between Top1000funds.com and CEM Benchmarking, measures the transparency of disclosures across cost, governance, performance and responsible investment for 75 funds across 15 countries, with the aim of improving industry transparency.

The fourth edition of the GPTB reveals again that increased scrutiny on public disclosures is driving measurable improvements. Last year, 77 per cent of the reviewed organisations improved their total transparency scores. This year 69 per cent of funds scored higher.

In 2024, the average fund scored 63 out of 100, versus 60 last year, and 55 in 2022. The funds at the top of the rankings continue to improve the most.

For the second year running, the Government Pension Fund Global topped the list of the most transparent funds, narrowly beating CPP Investments. [See Norway takes out top spot on transparency, with a perfect score]

This year, the survey was updated with three goals in mind: removing or improving overly interpretative questions; keeping the responsible investment survey current; and keeping the cost disclosure requirements consistent with reporting best practice as set out by CEM’s Global Reporting Principles. The change in methodology hasn’t materially impacted fund or country rankings. [See the full questionnaire here]

The progress of the best performing funds combined with the improved transparency of responsible investing and governance disclosures are driving funds to record heights according to the results of the 2024 Global Pension Transparency Benchmark.

The GPTB, a collaboration between Top1000funds.com and CEM Benchmarking, measures the transparency of disclosures across cost, governance, performance and responsible investment factors for 75 funds across 15 countries, with the aim of improving industry transparency.

The fourth edition of the GPTB reveals again that increased scrutiny on public disclosures is driving measurable transparency improvements.

In 2024, the average fund scored 63 out of 100, versus 60 last year, and 55 in 2022.

The 2024 results reveal that for the second year in a row the overall quality of pension fund disclosures jumped, with 69 per cent of funds making improvements in their scores on the back of 77 per cent of funds improving scores in 2023.

This year’s average country score on responsible investing was 67 out of 100, up from 59 in last year’s review, marking the biggest relative improvement of any of the four factors.

The average country score on governance was 74 out of a possible 100, an increase of three points on last year’s average score of 71.

Six funds scored a perfect 100 across a certain factor, with Norway’s SWF scoring 100 in all four and taking the top spot in the fund rankings for the second year in a row. [See Norway takes out top spot on transparency, with a perfect score]

In total there were 11 perfect scores across different funds and factors.

Edsart Heuberger, CEM Benchmarking’s product lead for transparency benchmarking, says it is heartening to see that the Global Pension Transparency Benchmark has driven organisations globally to improve transparency in the last four years.

“For leading funds, the GPTB methodology has become a roadmap for improving transparency,” he says.

“These funds have addressed the gaps in their score. Governance, as an example, is an area where funds typically own all the data that is required to achieve a score of 100 – they just need to disclose it. It has become a norm for more funds to disclose executive and board remediation, or to contrast actual board member competencies against desired competencies.”

Cost

Cost scores were based on 29 questions across three components common to all, plus eight questions focused on member services.

There are barriers to comparing fund costs across the globe. Differences in tax treatment, organisation/plan types, and accounting and regulatory standards mean that it is difficult to find common ground for assessment. Thus, the review is not meant to be a comprehensive review of all cost disclosure elements, as they vary from region to region and even from fund to fund. Rather, it is focused on the material areas common to most funds.

The average country cost factor score was 49, down slightly from last year’s review score of 51. Individual fund scores ranged from a low of four to a perfect 100.

Completeness of external management fees is the lowest-scoring cost component, followed by detailed asset-class cost disclosure.

As the dispersion in scores suggests, completeness of cost disclosures varied considerably. Quality ranged widely as well, though qualitative factors were out of scope. Disclosures were better when the pension fund (defined benefit or defined contribution) was a single-purpose entity rather than a silo of a larger organisation, such as a wealth management company or a government department.

The Netherlands continued to lead the way, with the highest country score of 89. The top three cost factor scores were held by The Netherlands, Canada and Australia. The primary distinguishing factor of these countries is a strict regulatory environment.

Governance

Organisations were scored based on 35 questions across four components. The average country score of 74 out of a possible 100 represented an increase of three from last year’s average score of 71.

The biggest Canadian public funds continued to be the leaders in governance disclosures, consistent with their reputation for excellent governance. Australia, Sweden, Denmark, and Finland improved scores significantly as they made changes to improve governance disclosures.

Last year’s review noted that governance scores were most closely correlated with the overall score and posited that as good governance produces positive results, it creates greater incentive (or perhaps less disincentive) to be transparent with stakeholders. There is evidence of a relationship between responsible investing and governance scores: good governance allows funds to move beyond simply managing assets and towards addressing wider environmental and social issues.

Performance

Performance scores were based on up to 44 questions across seven components common to all, and two (member services and funded status) that were only applicable for some organisations. The overall average score of 63 was down one from 64 last year, and the third highest scoring factor after governance and responsible investing. Individual fund scores ranged from 19 to 100.

Current-year disclosures were generally comprehensive at the total fund or investment option level. In contrast, reporting on longer time periods and asset class results were more often minimal or missing, although more funds were observed disclosing intermediate (that is, three to seven year) performance figures.

Components with the highest scores continued to include asset mix and portfolio composition, and risk policy and measures. Similarly, the lowest scores were seen for asset class returns, and value added and benchmark disclosures.

Canadian and American funds now lead the way, with an average country score of 89 for the performance factor.

Responsible investing

Funds were scored based on 48 questions across three major components. The average country score was 67 out of 100, up from 59 in last year’s review, once again marking the biggest relative improvement among any of the four factors. Improvements to disclosures were evident across all components and most countries.

RI continued to exhibit the widest dispersion of scores, reflecting that countries are at different stages of implementing RI within their investing framework. Average country scores ranged from 0 to 100.

Canada ranks in first place, with a score of 96. The Dutch and Swedish funds were not far behind, scoring 92 and 89 points respectively.  Both countries deomstrated improved disclosures over the past year. The Nordic countries – Sweden, Denmark, Finland, and Norway – as a region continued to do very well on RI, with all receiving scores above the overall average.

survey improvements

This year, the survey was updated with three goals in mind: removing or improving overly interpretativequestions; keeping the responsible investment survey current; and keeping cost disclosure requirements consistent with reporting best practice as set out by CEM’s Global Reporting Principles. The change in methodology hasn’t materially impacted fund or country rankings.

“The survey has become less interpretative, which is critical for this benchmarking exercise,” Heuberger says.

“The responsible investing survey was also changed to be more standard-agnostic, and therefore more flexible and likely to remain current. There are still steps to take to improve the survey further. We continue to look for ways to assess readability. Transparency also means information is easy to find.”