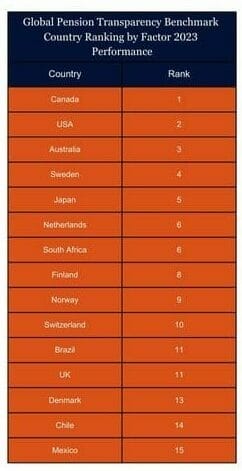
Canada is a standout in the transparency of pension fund reporting, topping the list of countries for the third year in a row, with a score of 83, and eight points clear of the next best country score.

In a benchmarking first, all five assessed Canadian funds feature in the top 10, with an average improvement in this year’s score of eight points, showcasing that improvements can be made even when funds are already demonstrating best practice.

The top five countries were rounded out by The Netherlands, Australia, Sweden and the United Kingdom.

Australia was the single biggest country improver, increasing its country score by 10 points, and making its way into the top three by nudging out Sweden.

CEM Benchmarking product lead for transparency benchmarking Edsart Heuberger said Australia’s country improvements were driven by AustralianSuper’s better performance, and by Australian Retirement Trust, a fund created from the merger of QSuper and Sunsuper, scoring much higher than QSuper alone did last year.

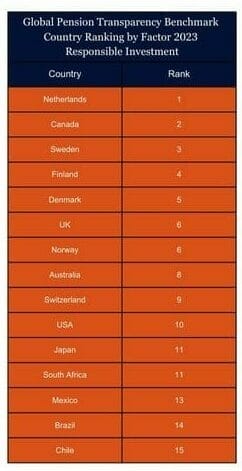
As well as ranking first among the countries reviewed, Canadian funds collectively were the best funds for disclosure around governance and performance. Dutch funds also deserve an honourable mention: collectively they provided the best disclosures on cost and responsible investing.

The past three years has seen gains in transparency across all factors but there is still room for improvement, particularly when it comes to transparency of disclosure around costs.

“Leading countries excel in different areas,” CEM’s Heuberger says.

“Canadians have terrific reporting on governance and investment performance, the Dutch are world-class on costs, and the Nordics excel in responsible investing.

“Generally, funds would gain the most by improving their external investment cost and responsible investing disclosures.”

The GPTB does not account for different regulatory regimes, but it acknowledges that different regulators are driving different disclosure requirements that could impact fund disclosures and comparability.

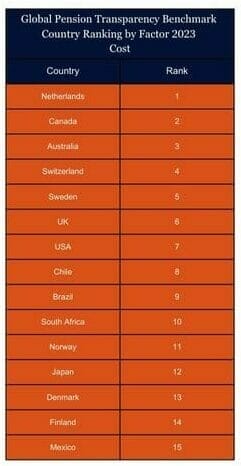
This is seen particularly in the cost factor, where the top three scores were held by The Netherlands, Canada and Australia. The primary distinguishing factor of these leading funds is the strict regulatory environment that they operate in. (See story on factor scores.)

The Global Pension Transparency Benchmark is a collaboration between Top1000funds.com and CEM Benchmarking and a world-first global benchmark measuring the transparency of disclosures of 15 pension systems across the value-generating measures of cost, governance, performance and responsible investments

It ranks countries on public disclosures of key value-generation elements for the five largest pension fund organisations within each country.


The country rankings are now in their third year, with the scores of the 75 underlying funds published for the second time this year.

The GPTB focuses on the transparency and quality of public disclosures with quality relating to the completeness, clarity, information value and comparability of disclosures.

The overall scores and rankings are measured by assessing hundreds of underlying components and analysing more than 13,000 data points.

For all the scores and rankings by country, fund and factor click here


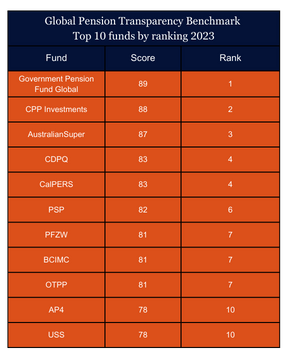
The highest scoring funds overall in the 2023 Global Pension Transparency Benchmark were also among the biggest improvers. Both Norway’s Government Pension Fund Global and AustralianSuper increased their scores by 14 points year on year and were the biggest improvers in the top 10. Other top 10 improvers of note included Canada’s CDPQ, CalPERS from the USA and the Dutch fund PFZW.

Overall the 2023 results revealed that the average fund improved by five points compared to 2022, but four of the five leading funds improved by more than 10 points, showcasing the importance the top funds put on transparency and that improvements can be made even when funds are demonstrating best practice.

The results of the GPTB this year revealed a jump in the overall quality of pension fund disclosures with 77 per cent of funds making improvements in their scores.

Outside the top 10 South Africa’s Eskom, Switzerland’s Migros, Finland’s VER, Brazil’s Itau Unibanco and Funcef, and New York City Retirement System all made significant progress in transparency and had noticeably improved scores.

The governance factor was the biggest improver of the four factors with 92 per cent of funds improving their score on this factor (see story on factor scores).

Edsart Heuberger, CEM Benchmarking’s product lead for transparency benchmarking said 58 of the 75 reviewed organisations improved their total transparency scores.

“It is great to see so many funds engaged in transparency and improving their transparency. The five leaders increased their transparency the most, with some declaring they want to be the best in the world,” he said. “Some funds have been really proactive, they want to be better. This year there has been more discussion about the importance of transparency and the benchmark has driven change and put a line on best practice.”

GPTB advisory board member Keith Ambachtsheer said it was fascinating to see the increases in both fund engagement and in the GPTB scores this year.

“The Peter Drucker observation that “what gets measured gets managed” is alive and well,” he said.

The Global Pension Transparency Benchmark, a collaboration between Top1000funds.com and CEM Benchmarking, is a world first global benchmark measuring the transparency of disclosures of 15 pension systems across the value generating measures of cost, governance, performance and responsible investments.

It ranks countries on public disclosures of key value generation elements for the five largest pension fund organisations within each country. The country rankings are now in their third year, with the scores of the 75 underlying funds published for the second time this year.

The GPTB focuses on the transparency and quality of public disclosures with quality relating to the completeness, clarity, information value and comparability of disclosures.

The overall scores and rankings are measured by assessing hundreds of underlying components and analysing more than 13,000 data points.

For all the scores and rankings by country, factor and all the 75 funds click here


Funds around the world improved their scores on responsible investment disclosure by more than on any of the three other factors assessed in the 2023 Global Pension Transparency Benchmark.

The GPTB measures the transparency of disclosures of 15 pension systems across the value-generating measures of cost, governance, performance and responsible investment. Scores of all four factors improved this year compared to last year.

Responsible investment disclosures showed the most improvement, with the average score improving by 20 per cent, from an average score of 49 to 59 year-on-year.

This was followed by the governance factor, which achieved the highest average score this year of 65 out of a possible 100, an improvement of 11 per cent for the year. The gain was driven by 92 per cent of funds improving their governance disclosure.

Average scores for performance disclosures declined slightly, from 64 to 62 year on year.

Cost scores improved from an average of 48 to 51; however, with the stark improvement of the responsible investment factor, cost disclosures now rate as the lowest average score of all the four factors. Only 45 per cent of funds improved their public reporting on costs.

CEM Benchmarking product lead for transparency benchmarking Edsart Heuberger says that funds would generally gain the most by improving their external investment cost and responsible investing disclosures.

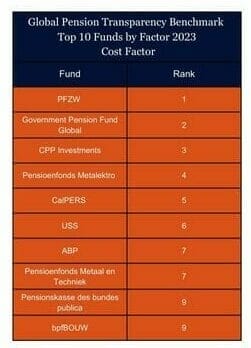
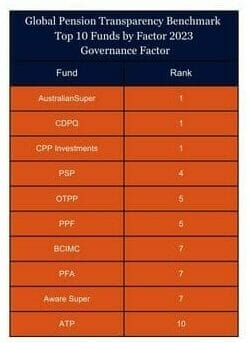
In terms of individual fund scores, the Dutch fund Stichting Pensioenfonds Zorg en Welzijn topped the list for cost. In the governance factor, three funds ranked equal first, all achieving the extraordinary result of full marks in their scores: Australia’s AustralianSuper, and Canada’s CDPQ and CPP Investments.

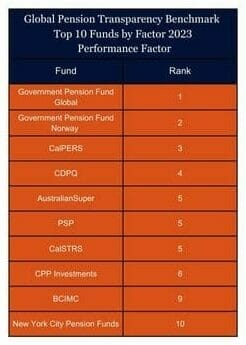
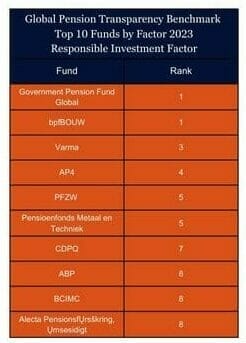
Norway’s Government Pension Fund Global was the best fund for transparency of disclosures related to performance and also took equal top spot with Dutch fund bpfBOUW for responsible investment.

In last year’s review it was noted that governance scores were most closely correlated with the overall score, and that perhaps it was the case that as good governance produces positive results, it creates greater incentive (or perhaps less disincentive) to be transparent with stakeholders.

CEM observes this year that responsible investing disclosures showed an equal correlation with governance and that good governance allows funds to move beyond simply managing assets and towards addressing wider environmental and social issues.

Cost factor

The average country cost factor score was 51 but there was huge variation between individual funds, with scores ranging from 7 to 93. Heuberger says as the dispersion in scores suggest, cost disclosures varied considerably in completeness, and he urges funds to pay more attention to this factor.

CEM’s asset-owner performance database clearly shows that net returns are materially impacted by investment management costs, with about 75 per cent of gross returns above benchmarks going to pay related investment expenses.

But paying more does not necessarily get you more: CEM says cost-effective investment management strategies generally outperform high-cost approaches over the long-term. Costs matter, and they should be understood, managed, and disclosed.

Barriers to comparing costs around the globe include differences in tax treatment, organisation/plan types, and accounting and regulatory standards, which all mean it is difficult to find common ground for assessment.

Cost reporting seems to be the area where funds flounder a little bit,” Heuberger says.  “It takes considerable effort internally, and also requires external managers to report to you. It could take five to 10 years to see the change required.”

Governance factor

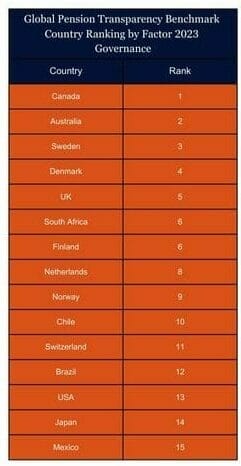
The average country score for governance was 71 out of a possible 100. This represented an increase of seven from last year’s average score of 64, and makes it the best rated of the four factors.

The governance factor was one of the standout results in this year’s GPTB, with three funds ranked equal first and all three achieving the extraordinary result of full marks: AustralianSuper, CDPQ and CPP Investments all scored 100.

The biggest Canadian public funds continued to be the leaders in governance disclosures, consistent with their reputation of excellent governance. All five Canadian funds included in the benchmark featured in the top 10 funds for governance disclosures, and were all in the top 10 funds overall.

 Performance factor

The overall average score for performance was 62, a slight decline from 64 last year. Average country scores ranged from 21 to 95.

The US and Canadian funds lead the way, with an average country score of 87 and 89 respectively.

These funds typically had extensive and good quality reporting across all performance components.


Responsible investing factor

Funds were scored based on 54 questions across three major components. The average country score was 49 out of 100 up from 42 in last year’s review, marking the biggest relative improvement among any of the four factors.

Improvements to disclosures were seen across all components and most countries, however this factor still has the greatest dispersion of scores reflecting that countries are at different stages of implementing responsible investing within their investing framework. Average country scores ranged from 0 to 94.

The Netherlands stole Sweden’s crown in this factor with a score of 77, besting the Swedish funds by a single point. Both countries had improved disclosures over the past year. The Nordic countries – Sweden, Denmark, Finland, and Norway – continued to do very well as a region on responsible investing, with all countries receiving scores well above average.

CEM’s Heuberger notes that funds were more likely to provide quantification of their responsible investing initiatives and this year, and that more funds went a step further and provided context by laying out longer-term goals.

“Several funds started producing stand-alone reports focused exclusively on responsible investing which provided comprehensive, holistic overviews of their programs,” he said.

While overall in the past three years there has been positive momentum in the advancement of transparency across all the factors, there is still room for improvement.

“Leading countries excel in different areas,” Heuberger said.

“Canadians have terrific reporting on governance and investment performance. The Dutch are world-class on costs. The Nordics excel in responsible investing.

“Generally, funds would gain the most by improving their external investment cost and responsible investing disclosures.”

 For all the scores and rankings by country, fund and factor click here

Is chasing the Canadian model of a large allocation to illiquid assets appropriate for every pension fund? It’s a question that the £34 billion multi-client asset owner Railpen has been investigating in research that examined the right target allocation to illiquid assets in the context of risk tolerance, flexibility and liquidity management.

“This is something we have wrestled with for a while,” head of investment strategy and research John Greaves says.

“Parking the strategic merits of investing in illiquid assets, we wanted to investigate our client’s liquidity capacity, or risk tolerance related to their allocation to illiquid assets, across private equity, private debt, infrastructure, real estate and other alternative illiquid assets.”

According to Greaves the most important thing in setting the limits on long-term illiquid asset allocation is the “portfolio steerability” which includes understanding the clients’ need for flexibility.

“Every investor has a tolerance for the portfolio to drift over time away from a strategic asset allocation,” he says.

“Illiquid asset classes tend to have smoothed and lagged asset valuations which can amplify this effect.”

Led by Lukas Vaiciulis, research by the strategy team – which will publish a working paper later this year – resulted in a framework that focused on scenario planning and the uncertainty inherent in illiquid investments.

Greaves says the allocation to illiquid assets has typically been approached by investors in a heuristic manner, with allocations determined by what “feels right”. A research literature review didn’t reveal much quantifiable research and yet it is one of the most important decisions that investors make.

“It is something you can plan for and think about what happens and what you would do under different scenarios,” Greaves says. “I was really keen we approach this in an open-minded way. I asked the team to tell me why we can’t do the Canadian model.”

Railpen’s scenario planning focused on the problem of over-allocation and the inability to get back to target in a reasonable timeframe or to deploy in favourable market conditions.

“We looked at the allocation drift and what the options were to rebalance, including secondary market transactions” Greaves said, in an interview in the fund’s Liverpool Street, London, office.

The impact on short-term liquidity management was also considered. “Typically, short-term liquidity risk is managed by maintaining a prudent level of cash-like assets against an extremely stressed cashflow scenario. However, the issues come when you need to recapitalise. What assets are you selling? What if the stress gets worse over the following months? We found these issues interacted with the illiquid assets, but it was only limiting at very high levels of illiquid assets given our cashflow profile and liquid asset mix.”

Uncertainty and lagged performance

The Railpen modelling also looked at the uncertainty of returns and cashflows and the impact of lagged returns and smoothing.

“We wanted to have a framework where we recognise the uncertainty with illiquid asset cashflows and can test different allocations against our risk appetite and make sure we are able to do what is needed for our clients in certain environments,” Greaves says.

A framework was developed that tested a number of scenarios including changing the strategic allocation without undermining the investment case of the investments.

“Investors allocate to long-term illiquid investments because it is bringing something to the overall portfolio, like additional return or diversification, and we need to hold the assets for a reasonable period of time to realise those benefits, it takes time to play out,” Greaves says.

“From a portfolio construction perspective, if you need to sell at the wrong time, it might undermine the reason for the investment in the first place. I think it is a common myth that you can just sell certain direct investments when you need to. There is typically an investment thesis that plays out over many years and of course large costs to buy and sell,” he says. “We want to try and avoid having to sell assets before we would like to or being unable to deploy in favourable market conditions, where possible.”

Testing the portfolio against various scenarios while being able to maintain investment discipline resulted in an allocation to illiquid assets for defined benefit (DB) schemes open to new members of around 30-40 per cent, much smaller than the allocations seen by the Canadian funds which in many cases is 60-70 per cent of the portfolio. This highlights the importance of recognising and understanding client-unique objectives, constraints, and opportunity sets in choosing the right investment strategy.

“We found when we go above a 40 per cent allocation to illiquid assets, we start to see a lot of drift, forced sales and big changes in the amount we can deploy each year, particularly in a scenario where the target changes” Greaves says.

The open DB pension schemes that Railpen manages are slightly cashflow-negative which also impacts the illiquid allocation.

“Cashflow positive funds can go higher,” Greaves says.

Flexibility, agility and change in processes

The research also looked at allowing for the target allocation to change through time. Flexibility is important if the belief is the right strategy for an open DB fund can change over time in response to market conditions and funding.

“We do think flexibility is important and we wanted to test the ability to change our mind in the future,” Greaves says.

“The results were somewhat non-contentious, but the exercise gave us some quantitative rigour and gave us some confidence. If the board says our mandate will never change then that’s different. Some funds like sovereign wealth funds perhaps have a more stable mandate.”

Railpen found the illiquid asset mix was also very important. “If we have more in direct, cashflow generative assets like infrastructure, or shorter-duration assets like private credit, then we could push it higher,” Greaves says. “Like anything in investing you look at your risk tolerance, investment beliefs, and where you can add value. This research helped us find our sweet spot at this time.”

The exercise resulted in the fund changing its approach to private asset allocations, reinforcing the idea of being proactive, adjusting pacing quite frequently.

“While private assets are a long-term investment it is not a set and forget,” Greaves says.

One of the practical changes in the process is the strategy team now regularly meets with the illiquid teams to talk about pacing.

The research was also a useful tool to talk to the board about the importance of flexibility and demonstrate different scenarios including one example which was reducing the illiquid assets from 40 to 20 per cent over five years.

“They got comfort that we demonstrated we can move from a relatively high allocation to something much lower in a short period of time through the cashflow profile of the assets, even in a shock or stressed environment” Greaves says.

Now the fund looks at its illiquid allocations in the context of the role the asset plays, the exit and the execution, in a dynamic approach. All Railpen investments are modelled with a cashflow profile and exit periods under different scenarios, with those assumptions kept up to date.

“In illiquid assets, the execution is so important,” Greaves says. “We are trying to think about the exit upfront and keeping the analysis up to date.”

The exercise also showed the importance of maintaining good market relationships with external managers, trying to maintain a good pace of investment with the best managers where possible. The impact on internal teams was also a consideration.

“Institutional investing is much more than just a good strategy. It’s the whole institutional investing ecosystem on how you deliver on that well”, he says.

“By thinking about these decisions through the lens of the overall institutional investment process, we believe it allows schemes like ours to better respond to client needs.”
 This article makes the case that energy is the metaphorical lifeblood of any system, and is therefore the fundamental systemic risk. This insight should inform how we go about our net-zero investing.

As my entry point, let me ask and answer a question: what is energy for? Removing humans from the frame momentarily, this leaves us free to observe that energy comes from the sun; that plants convert the sun’s energy via photosynthesis into sugars; that some animals eat the plants; and that other animals eat animals.

It follows that the plants need to replace what has been eaten. If there is any energy left over, the plant can think about growth – either making itself bigger, or by making copies of itself. From this, we can see that energy has two uses – maintenance, or the repair of damage, and growth, or the making of new things.

When something is new there is very little maintenance to do, allowing almost all the energy to be expended on growth. If it is also small, the rate of growth can be spectacular (low-base effect). Over time, parts wear out and need to be replaced so a larger and larger proportion of energy is spent on maintenance, and less is available for growth. In addition, the “thing” is now bigger and so the rate of growth falls, and eventually stops. Biological growth for an individual entity has a stopping rule; when all the incoming energy is required for maintenance, growth stops.

As we have removed humans for the time being, the “thing” above will be biological, but the principles also transfer to mechanical things. It takes energy to create a machine, and more energy to maintain it.

Returning to our human-free world, we can now start to think about systemic risk. Our thing will seek to replicate itself and grow its population. In isolation, a population can grow up to the limits of available energy. So the population of a bacterium in a petri dish will grow exponentially and then crash to zero when the food runs out. The population of rabbits on an island will rise and fall as it adjusts to the availability of grass. But populations rarely exist in isolation. Instead, we typically observe multiple populations existing simultaneously in an ecosystem, which introduces the complexity of different types of relationships – from symbiotic to predator-prey. These ecosystems can evolve to an equilibrium state, which will be within the limit of available energy, and the rates of extraction and rates of replacement will be equal (a prey species will have enough offspring to replace those being eaten).

Evolving towards equilibrium does not mean systemic risk is absent – just ask the dinosaurs. Even excluding external shocks posed by meteors, a new species could arrive over the hill and find that it is perfectly suited to this new environment. At best, the existing species will have to concede some ground to accommodate the new arrival. At worst, the newcomer outcompetes one of the existing components and sets off a cascade of consequences. Or, perhaps, the climate changes with a similar wide range of possible effects.

We can now re-introduce humans and let them do their thing. They build societies and economies (the ‘system’) some of which, over time, collapse. This thought piece would suggest that the collapsed historical systems out-grew their ability to maintain themselves.

One more thought before we get to our present context. When systems grow, they also increase in complexity. As the number of components grows, the number of possible connections between them explodes. Niches tend to get smaller, and specialisms deeper. There is now a need for energy to also support significant information processing. As we have discussed above, the availability of energy is a systemic risk. I see it as the fundamental systemic risk. And we increase that risk every time we grow our system. I suggest a hypothesis: human systems will always be associated with rising systemic risk. We apply our ingenuity to overcome system constraints. This leads some to believe that human ingenuity will always be able to overcome the next presenting problem. The other side of that trade is that, if we fail on any one occasion, then systemic risk may not show much mercy.

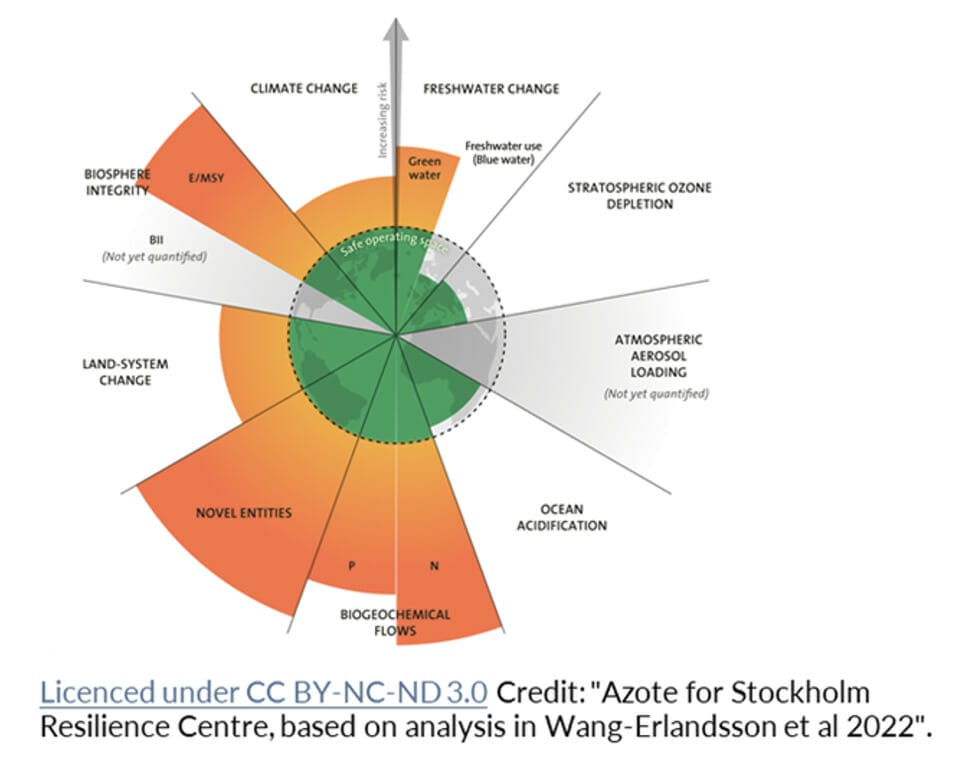
Our present context is illustrated by the graphic. It was created by Johan Rockström as part of his seminal work on planetary boundaries. This version contains 2022 data. The planetary boundaries are indicated by the dotted line. The colour green signifies activity within the boundary. The colour orange highlights activity beyond the boundary. The way we are running our system is – according to the scientists – literally unsustainable.

Climate change has captured the majority of the public attention, and emissions are in breach of their planetary boundary (and so our climate is warming and will continue to do so under present conditions). But the biodiversity problem is even worse – the label ‘E/MSY’ (extinctions per million-specie-years) shows it so much further beyond its planetary boundary. We should expect most ecosystems to change.

The chart also shows that we have big problems with plastics (‘novel entities’) and how we produce our food (‘land-system change’ and ‘biogeochemical flows’). If you believe the scientists have done good work and placed the boundaries in the correct places, then it is hard to think of any better visualisation for systemic risk. We are running our system too aggressively.

So, how might our current context of systemic risk and breached planetary boundaries play out? There are broadly two pathways – to deliberately manage the risk down through time, or to continue as we are and expect the system to reduce the risk in its own way at some stage through a collapse.

Hopefully the first option is obviously preferrable, but the difficulties of bringing it about are equally obvious. Global governance, and stronger national governance, would help.

However, the landing place I am aiming for is net-zero investing.

If it is true that a system will always try to grow unless constrained, then it follows that it will lap up any energy that is available, irrespective of its carbon content. This means that trying to reduce fossil fuel energy will be pushing against the ‘natural order of things’.

It further means that addressing systemic risk, and the breached planetary boundaries, will require the deliberate imposition of constraints – in order to change the shape of the system, and how (or whether) it can grow.

It is my belief that net-zero investing will need to incorporate this idea of constraints, so that it can succeed with the net-zero part of its mission.

Tim Hodgson is co-founder of the Thinking Ahead Institute at WTW, an innovation network of asset owners and asset managers committed to mobilising capital for a sustainable future.   

In a recent paper researchers from Singapore’s GIC, FTSE Russell and asset management group GMO explain why investors should integrate green revenues into their portfolio construction, arguing that the sustainability metric Weighted Average Green Revenue (WAGR) is a useful tool for investors looking to assess and integrate green opportunities.

Investors know that transitioning to a net-zero economy requires solutions that enable the economy to decarbonise like renewable energy, electric vehicles, and recycling technologies. The green economy is growing faster than broader equity markets, with a compound annual growth rate of around 13 per cent over the last decade while companies providing climate and environmental solutions have been outperforming the market since the early 2000s. Yet how best to measure portfolio exposure to climate-related investment opportunities remains an enduring challenge.

Focusing on specific themes such as renewable energy infrastructure is narrow and risks overlooking other critical segments of the green economy, such as long-range transportation, technology and resources. Comparability is further limited by varying definitions and methodologies for what constitutes a ‘green asset’.

“It needs an overarching metric applied consistently across asset classes, to compare the performance among asset classes and aggregate the results up to the portfolio level,” write the authors.

Additionally, the way asset owners disclose green investment exposure is often binary—a company or investment is tagged as green or not. This approach focuses on pure plays and does not consider the nuanced nature of a company’s business model, whereby some business lines are green, and others less so. It also fails to capture companies’ transition progress.

The right tools

The best and most comprehensive metrics to measure portfolio exposure to green solutions comprise green revenue, green capex, green patents and avoided emissions, states the report. Of all these, green revenue is easier to interpret; directly links to companies’ cash flows and real-world impact, and the data is more readily available and comparable.

WAGR calculates the green revenue percentage (GR per cent) of a portfolio by applying company GR per cent to the portfolio weight of each company. Investors can set portfolio-level targets of climate solutions using WAGR, such as a minimum level, an improvement relative to the benchmark, or to track specific WAGR pathways such as decarbonisation trajectories.

The calculation of WAGR is straightforward and easy to implement. It is also highly comparable across equity portfolios and indices given most of them use market capitalisation to determine stock weight. This makes it easier to compare portfolio performance against benchmarks. In addition, it echoes the method recommended by the Technical Expert Group (TEG) on Sustainable Finance for measuring alignment of equity investment with the EU Taxonomy.

The modular nature of the underlying green revenues data allows investors to measure portfolio exposures to individual climate solutions. WAGR can be broken down into different technologies across sectors, subsectors and micro sectors providing flexibility for investors seeking investment opportunities in specific sectors, states the paper.

Moreover, by using the Weighted Average Green Revenue (WAGR) to measure and analyse portfolio exposure to climate solutions investors can build on the portfolio weighting methodology used in carbon metrics such as Weighted Average Carbon Intensity (WACI), already widely adopted.

Green revenues

Green revenue companies by market capitalisation are diverse across industries, although they tend to be clustered in certain large sectors, such as technology and industrial goods and services. Several industries have higher WAGR particularly the automotive sector (36 per cent) and utilities (29 per cent), driven by demand for electric vehicles and renewable energy generation.

Growth in the auto industry’s green revenue weighted market cap is a more recent trend, having increased by over 350 per cent between 2019 and 2020. While climate solutions are often thought of as solely focused on renewable energy and electric vehicles, in reality, they represent a diverse set of activities spanning multiple points up and down value chains. For instance, energy management and efficiency have constituted at least a third of the green economy since 2016, driven by building and industry energy efficiency measures.

A portfolio can use WAGR to target an increase in its exposure to climate solutions and the broader green economy.

Using WAGR, the researchers analyse portfolio exposure to climate solutions, including size, growth, industries, green sectors, regions, and the level of ‘greenness.’

Potential investor applications of WAGR include climate reporting against frameworks such as the Task Force on Climate-related Financial Disclosures (TCFD), target setting, thematic investing and corporate engagement. However, investors should acknowledge the constraints and trade-offs when building portfolios with a significantly greater WAGR, such as sector and country concentration, volatility and the size of the universe.

The transition to a green economy is still in its early stages, resulting in relatively low WAGR for market capitalisation based indices. In 2022, the WAGR of the FTSE All-World Index was less than 8%. To achieve portfolios that resemble an index but have a significantly greater WAGR, large positioning deviations are necessary.

“We also find these portfolios have concentrated exposures to certain countries and industries. For example, a portfolio with 50% WAGR has a 14% overweight on China and an 18% underweight on the United States,” write the authors.

The researchers note other challenges like a lack of disclosures based on green revenues. In addition, climate-related disclosures in private markets, including green revenue data, continue to be in short supply, limiting access to comparable data across different asset classes for investors.

However, by raising greater awareness of the value of WAGR to assess and integrate green opportunities into portfolio construction the authors hope to encourage greater disclosures. In conjunction with other sustainability metrics, WAGR can be a useful tool to calibrate and measure exposure to climate solutions in a portfolio management context, they conclude.